3000.
Open browser and go to http://localhost:3000admin for the username and
password.
skip if you don’t want to change it.
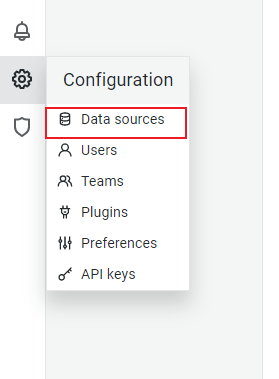
## Add Data Source
Go to https://grafana.com/grafana/download,
and select a version. OSS Edition 8.5.3 is selected in this
guideline.
#### For RHEL/CentOS
wget https://dl.grafana.com/oss/release/grafana-8.5.3-1.x86_64.rpm
sudo yum install grafana-8.5.3-1.x86_64.rpmwget https://dl.grafana.com/oss/release/grafana-8.5.3-1.x86_64.rpm
sudo rpm -i --nodeps grafana-8.5.3-1.x86_64.rpmsystemctl daemon-reload
systemctl enable grafana-server
systemctl start grafana-server3000.
Open browser and go to http://localhost:3000admin for the username and
password.skip if you don’t want to change it.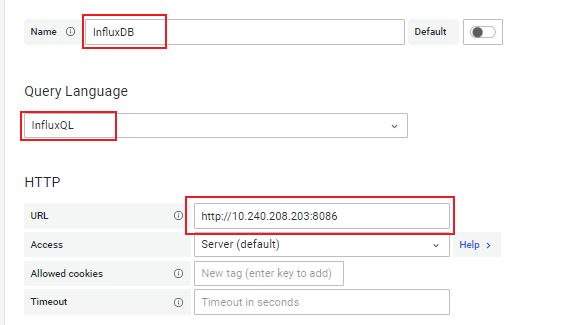
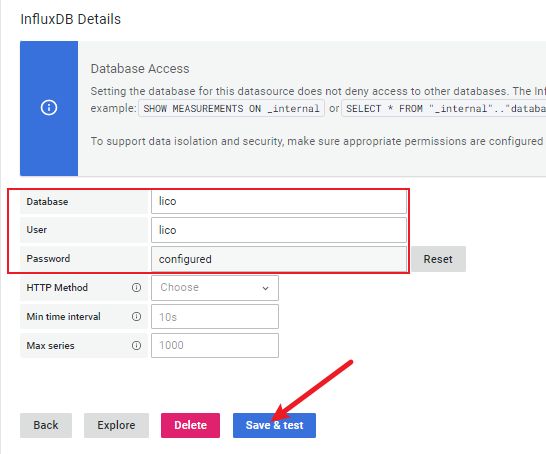
Name: Enter a data source name
Query Language: Choose InfluxQL
HTTP -> URL: Database URL
InfluxDB Detail -> Database: Database name
InfluxDB Detail -> User: Database username
InfluxDB Detail -> Password: Database password
After the configuration is completed, click Save & test.
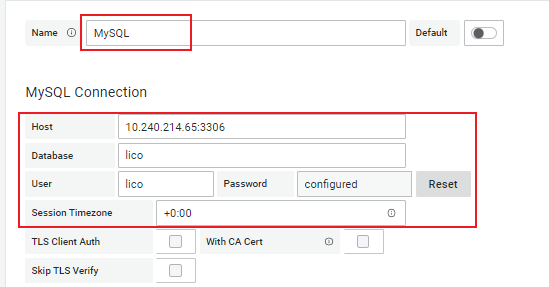

Name: Enter a data source name
MySQL Connection -> Host: Database hostname or IP address
MySQL Connection -> Database: Database name
MySQL Connection -> User: Database username
MySQL Connection -> Password: Database password
MySQL Connection -> Session Timezone: Database timezone
After the configuration is completed, click Save & test.
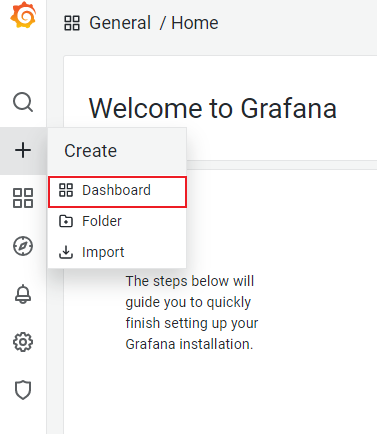
Click  button, enter a
dashboard name, then save it. ### Export Model Click
button, enter a
dashboard name, then save it. ### Export Model Click  button in a dashboard, jump
to JSON Model. Copy JSON Model content, and save it as a local JSON
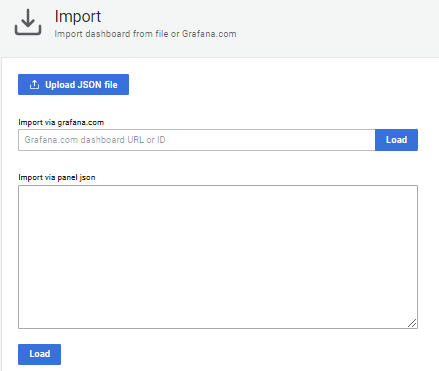
file. ### Import Model Grafana website offers some dashboard models. You
can enter a dashboard URL or ID to load a model. Importing a local JSON
file is also an alternative choice.
button in a dashboard, jump
to JSON Model. Copy JSON Model content, and save it as a local JSON
file. ### Import Model Grafana website offers some dashboard models. You
can enter a dashboard URL or ID to load a model. Importing a local JSON
file is also an alternative choice.
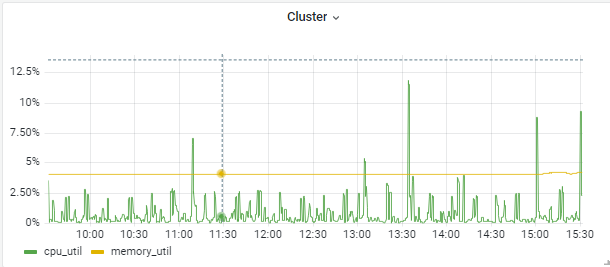
The panel shows CPU utility and memory utility of a cluster.
Select InfluxDB as data source. Use cluster_metric as the
measurement. Below describes data structure and field type of
cluster_metric:
| Field | Type |
|---|---|
| time | Time |
| host | String |
| metric | String |
| value | Number |
Specifically, metric includes:
cpu_num: CPU core number
cpu_util: CPU utility
disk_total: Disk storage capacity, displayed in GB
disk_used: Used space of disk storage, displayed in GB
eth_in: Ethernet downlink rate, displayed in MB/s
eth_out: Ethernet uplink rate, displayed in MB/s
gpu_allocable_total: Total number of allocable GPU resource
gpu_allocable_used: Used allocable GPU resource
gpu_mem_total: GPU memory capacity, displayed in KiB
gpu_mem_used: Used GPU memory, displayed in KiB
gpu_mem_util: GPU memory utility
gpu_mig_total: Total number of MIG instances
gpu_mig_used: Used MIG instances
gpu_total: Total number of GPU cards
gpu_used: Used GPU cards
gpu_util: GPU utility
ib_in: IB downlink rate, displayed in MB/s
ib_out: IB uplink rate, displayed in MB/s
memory_total: Memory capacity, displayed in KB
memory_used: Used memory, displayed in KB
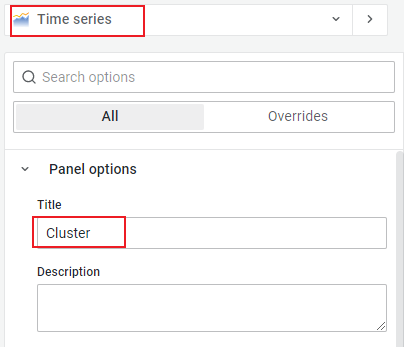
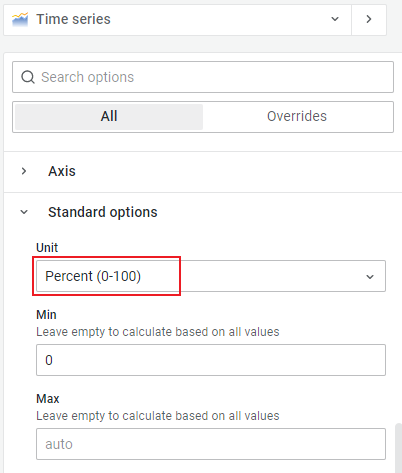
memory_util: Memory utilityAs depicted in the following figures, choose Time Series
as visualization, and select Percent(0-100) as Unit.
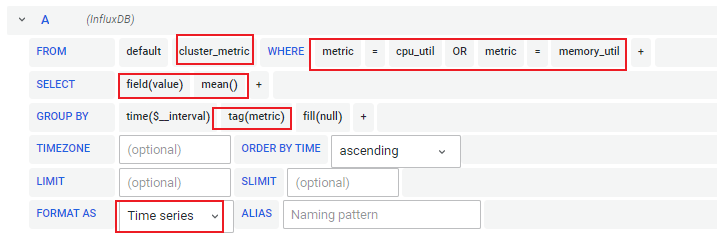
Or click  button to enter
raw query mode, and input the SQL below:
button to enter
raw query mode, and input the SQL below:
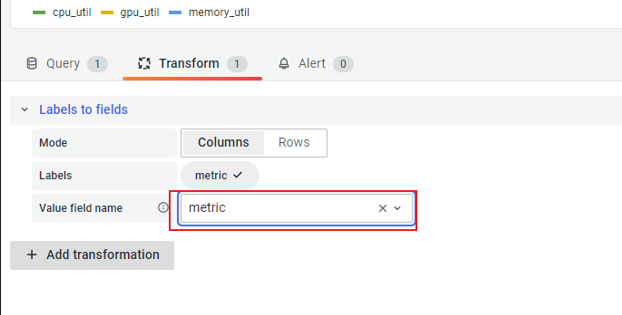
SELECT mean("value") FROM "cluster_metric" WHERE ("metric" = 'cpu_util' OR "metric" = 'memory_util') AND $timeFilter GROUP BY time($__interval), "metric" fill(null)Add Transform - Labels to fields, which changes label names into
metric values.
Two panels, CPU Utility and Memory Utility, will be
added.
Select InfluxDB as data source. Use node_metric as the
measurement. Below describes data structure and field type of
node_metric:
| Field | Type | | —— | —— | | time | Time | | host | String | | metric
| String | | value | String | Specifically, metric
includes:
cpu_num: CPU core number
cpu_util: CPU utility
cpu_load: CPU load
cpu_thread_per_core: Threads per core
cpu_core_per_socket: Cores per socket
cpu_socket_num: CPU number
hypervisor_vendor: Hypervisor vendor
disk_total: Disk storage capacity, displayed in GB
disk_used: Used space of disk storage, displayed in GB
disk_util: Disk utility
eth_in: Ethernet downlink rate, displayed in MB/s
eth_out: Ethernet uplink rate, displayed in MB/s
gpu_allocable_total: Total number of allocable GPU resource
gpu_allocable_used: Used allocable GPU resource
gpu_mem_total: GPU memory capacity, displayed in KiB
gpu_mem_used: Used GPU memory, displayed in KiB
gpu_mem_util: GPU memory utility
gpu_mig_total: Total number of MIG instances
gpu_mig_used: Used MIG instances
gpu_total: Total number of GPU cards
gpu_used: Used GPU cards
gpu_util: GPU utility
ib_in: IB downlink rate, displayed in MB/s
ib_out: IB uplink rate, displayed in MB/s
memory_total: Memory capacity, displayed in KB
memory_used: Used memory, displayed in KB
memory_util: Memory utility
node_power: Node energy, displayed in W
node_temp: Node temperature, displayed in C
node_health: Node health information, stored in JSON format
node_active: Node power status, power on or power offThe panel shows CPU utilities of all the nodes in a cluster.
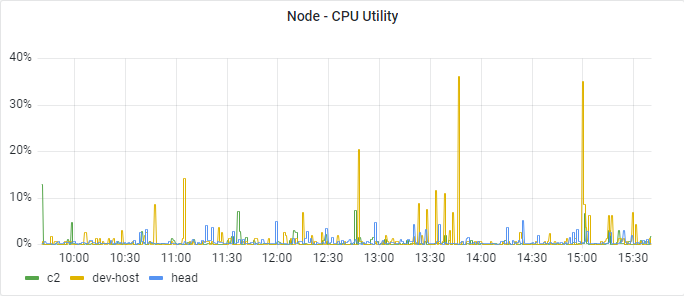
As depicted in the following figures, choose Time Series as
visualization, and select Percent(0-100) as Unit.
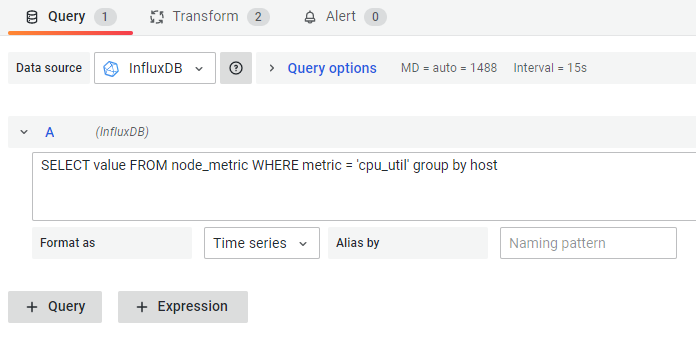
Since the metric value type is string, it is essential to click  button and enter raw query mode first.
Then input the SQL below.
button and enter raw query mode first.
Then input the SQL below.
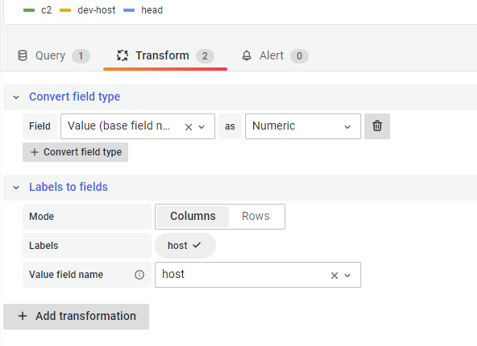
SELECT value FROM node_metric WHERE metric = 'cpu_util' group by hostAdd Transform - Convert field type, which converts value’s string
type into digital type.
Add Transform - Labels to field, which changes label names into host
names.
The panel shows memory utilities of all the nodes in a cluster.
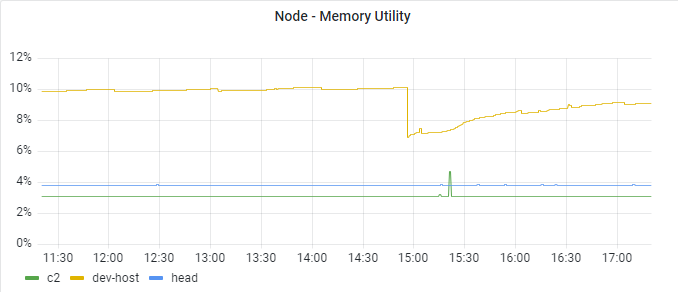
Enter raw query mode and input the SQL below.
SELECT value FROM node_metric WHERE metric = 'memory_util' group by hostKeep the rest same with CPU Utility Panel.
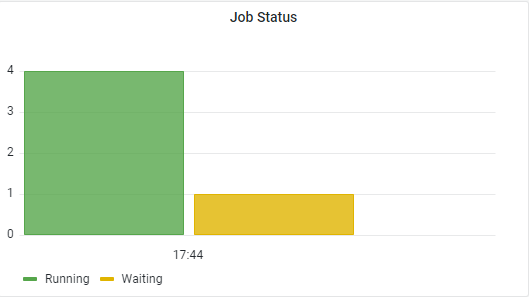
The panel shows the numbers of running and waiting jobs at
present.
Select MySQL as data source. Use job_job as the table.
Below describes data structure and field type of
job_job:
| Field | Type | Description |
|---|---|---|
| id | int | Primary key |
| scheduler_id | varchar | Scheduler ID |
| identity_str | longtext | Saved in JSON format |
| job_name | varchar | Job name |
| job_content | longtext | Job content |
| queue | varchar | |
| submit_time | datetime | |
| start_time | datetime | |
| end_time | datetime | |
| submitter | varchar | |
| job_file | varchar | Job file path |
| workspace | varchar | |
| scheduler_state | varchar | Scheduler state. There’s a mapping relationship with the field
state |
| state | varchar | C: Completed; Q: Queuing; R: Running; H: Hold; S: Suspended; UN: Unknown |
| operate_state | varchar | creating; create_fail; created; cancelling; cancelled |
| delete_flag | boolean | To identify if the job is deleted |
| runtime | int | Job runtime, displayed in second |
| standard_output_file | varchar | Standard output file path |
| error_output_file | varchar | Error output file path |
| raw_info | longtext | Generated by scheduler command line with
scheduler_id |
| reason | longtext | Scheduling failure reason |
| comment | varchar | |
| exit_code | varchar | |
| tres | longtext | Trackable resources occupied for this job |
| create_time | datetime | |
| update_time | datetime | |
| user_comment | longtext | |
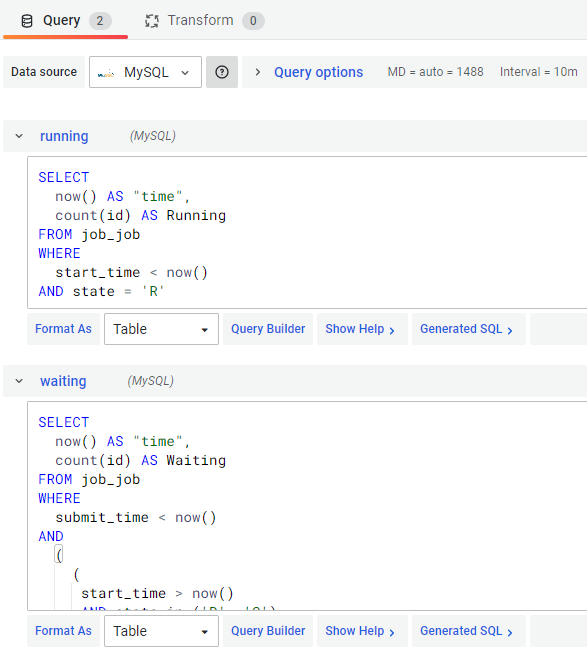
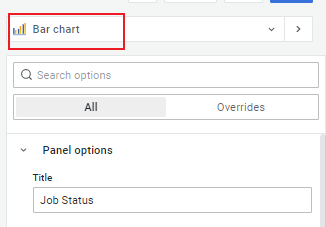
As depicted in the following figures, choose Bar chart
as visualization and add a query for each running and waiting
state. |
||
 |
||
 |
||
| Enter raw query mode and input the SQL below. |
-- Running State
 SELECT now() AS "time", count(id) AS Running FROM job_job
 WHERE
  start_time < now()
 AND state = 'R'

 -- Waiting State
 SELECT now() AS "time", count(id) AS Waiting FROM job_job
 WHERE
  submit_time < now()
 AND
  (
    (start_time > now()AND state in ('R', 'C'))
    OR state in ('Q', 'H', 'S')
  )
Click button after the
dashboard is completed.
Modify auth.anonymous in /etc/grafana/grafana.ini
[auth.anonymous]
    enabled = true       # Allow anonymous user to login
    org_role = Viewer    # Grant read-only permission to anonymous user
Modify /etc/lico/portal.conf as follows in order to add a grafana menu bar in LiCO.
{
  "quick-link": [
    {
      "label": "grafana",
      "url": "<dashboard url>",  # Replace with your dashboard url
      "access": "admin"   # Admin users have access to the menu bar by default. Options: admin,operator,user
    }
  ]
}
After the configuration, restart LiCO.
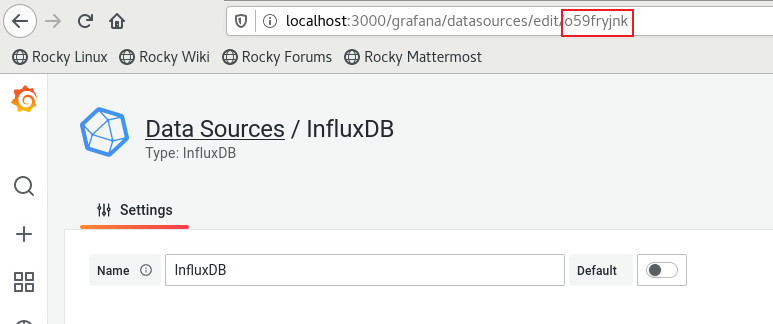
systemctl restart licoNote: You need to replace data source UID with your
own one before importing a local JSON Model. UID could be found within
the data source URL. Take InfluxDB as an example, o59fryjnk
is its data source UID.
The following shows the JSON Model of the dashboard created above:
{
"annotations": {
"list": [
{
"builtIn": 1,
"datasource": {
"type": "grafana",
"uid": "-- Grafana --"
},
"enable": true,
"hide": true,
"iconColor": "rgba(0, 211, 255, 1)",
"name": "Annotations & Alerts",
"target": {
"limit": 100,
"matchAny": false,
"tags": [],
"type": "dashboard"
},
"type": "dashboard"
}
]
},
"editable": true,
"fiscalYearStartMonth": 0,
"graphTooltip": 0,
"id": 7,
"links": [],
"liveNow": false,
"panels": [
{
"datasource": {
"type": "influxdb",
"uid": "o59fryjnk"
},
"fieldConfig": {
"defaults": {
"color": {
"mode": "palette-classic"
},
"custom": {
"axisLabel": "",
"axisPlacement": "auto",
"barAlignment": 0,
"drawStyle": "line",
"fillOpacity": 0,
"gradientMode": "none",
"hideFrom": {
"legend": false,
"tooltip": false,
"viz": false
},
"lineInterpolation": "linear",
"lineWidth": 1,
"pointSize": 5,
"scaleDistribution": {
"type": "linear"
},
"showPoints": "auto",
"spanNulls": false,
"stacking": {
"group": "A",
"mode": "none"
},
"thresholdsStyle": {
"mode": "off"
}
},
"mappings": [],
"min": 0,
"thresholds": {
"mode": "absolute",
"steps": [
{
"color": "green",
"value": null
},
{
"color": "red",
"value": 80
}
]
},
"unit": "percent"
},
"overrides": []
},
"gridPos": {
"h": 8,
"w": 12,
"x": 0,
"y": 0
},
"id": 2,
"options": {
"legend": {
"calcs": [],
"displayMode": "list",
"placement": "bottom"
},
"tooltip": {
"mode": "single",
"sort": "none"
}
},
"targets": [
{
"datasource": {
"type": "influxdb",
"uid": "o59fryjnk"
},
"groupBy": [
{
"params": [
"$__interval"
],
"type": "time"
},
{
"params": [
"metric"
],
"type": "tag"
},
{
"params": [
"null"
],
"type": "fill"
}
],
"measurement": "cluster_metric",
"orderByTime": "ASC",
"policy": "default",
"query": "SELECT mean(\"value\") FROM \"cluster_metric\" WHERE $timeFilter GROUP BY time($__interval), \"metric\" fill(null)",
"rawQuery": false,
"refId": "A",
"resultFormat": "time_series",
"select": [
[
{
"params": [
"value"
],
"type": "field"
},
{
"params": [],
"type": "mean"
}
]
],
"tags": [
{
"key": "metric",
"operator": "=",
"value": "cpu_util"
},
{
"condition": "OR",
"key": "metric",
"operator": "=",
"value": "memory_util"
},
{
"condition": "OR",
"key": "metric",
"operator": "=",
"value": "gpu_util"
}
]
}
],
"title": "Cluster",
"transformations": [
{
"id": "labelsToFields",
"options": {
"valueLabel": "metric"
}
}
],
"type": "timeseries"
},
{
"datasource": {
"type": "influxdb",
"uid": "o59fryjnk"
},
"fieldConfig": {
"defaults": {
"color": {
"mode": "palette-classic"
},
"custom": {
"axisLabel": "",
"axisPlacement": "auto",
"barAlignment": 0,
"drawStyle": "line",
"fillOpacity": 0,
"gradientMode": "none",
"hideFrom": {
"legend": false,
"tooltip": false,
"viz": false
},
"lineInterpolation": "linear",
"lineWidth": 1,
"pointSize": 5,
"scaleDistribution": {
"type": "linear"
},
"showPoints": "auto",
"spanNulls": false,
"stacking": {
"group": "A",
"mode": "none"
},
"thresholdsStyle": {
"mode": "off"
}
},
"mappings": [],
"min": 0,
"thresholds": {
"mode": "absolute",
"steps": [
{
"color": "green",
"value": null
},
{
"color": "red",
"value": 80
}
]
},
"unit": "percent"
},
"overrides": []
},
"gridPos": {
"h": 8,
"w": 12,
"x": 12,
"y": 0
},
"id": 4,
"options": {
"legend": {
"calcs": [],
"displayMode": "list",
"placement": "bottom"
},
"tooltip": {
"mode": "single",
"sort": "none"
}
},
"targets": [
{
"alias": "",
"datasource": {
"type": "influxdb",
"uid": "o59fryjnk"
},
"groupBy": [],
"measurement": "node_metric",
"orderByTime": "ASC",
"policy": "default",
"query": "SELECT value FROM node_metric WHERE metric = 'cpu_util' group by host",
"rawQuery": true,
"refId": "A",
"resultFormat": "time_series",
"select": [
[
{
"params": [
"value"
],
"type": "field"
}
]
],
"tags": [
{
"key": "metric",
"operator": "=",
"value": "cpu_util"
},
{
"condition": "OR",
"key": "metric",
"operator": "=",
"value": "disk_util"
}
]
}
],
"title": "Node - CPU Utility",
"transformations": [
{
"id": "convertFieldType",
"options": {
"conversions": [
{
"destinationType": "number",
"targetField": "Value"
}
],
"fields": {}
}
},
{
"id": "labelsToFields",
"options": {
"mode": "columns",
"valueLabel": "host"
}
}
],
"type": "timeseries"
},
{
"datasource": {
"type": "mysql",
"uid": "9jkl9yj7k"
},
"fieldConfig": {
"defaults": {
"color": {
"mode": "palette-classic"
},
"custom": {
"axisLabel": "",
"axisPlacement": "auto",
"barAlignment": 0,
"drawStyle": "line",
"fillOpacity": 40,
"gradientMode": "opacity",
"hideFrom": {
"legend": false,
"tooltip": false,
"viz": false
},
"lineInterpolation": "linear",
"lineWidth": 2,
"pointSize": 5,
"scaleDistribution": {
"type": "linear"
},
"showPoints": "never",
"spanNulls": false,
"stacking": {
"group": "A",
"mode": "normal"
},
"thresholdsStyle": {
"mode": "off"
}
},
"mappings": [],
"min": 0,
"thresholds": {
"mode": "absolute",
"steps": [
{
"color": "green",
"value": null
},
{
"color": "red",
"value": 80
}
]
}
},
"overrides": [
{
"matcher": {
"id": "byName",
"options": "Waiting"
},
"properties": [
{
"id": "color",
"value": {
"fixedColor": "green",
"mode": "fixed"
}
}
]
},
{
"matcher": {
"id": "byName",
"options": "Running"
},
"properties": [
{
"id": "color",
"value": {
"fixedColor": "blue",
"mode": "fixed"
}
}
]
}
]
},
"gridPos": {
"h": 8,
"w": 24,
"x": 0,
"y": 8
},
"id": 6,
"interval": "10m",
"options": {
"legend": {
"calcs": [],
"displayMode": "list",
"placement": "bottom"
},
"tooltip": {
"mode": "single",
"sort": "none"
}
},
"pluginVersion": "8.5.3",
"targets": [
{
"datasource": {
"type": "mysql",
"uid": "9jkl9yj7k"
},
"format": "time_series",
"group": [],
"metricColumn": "none",
"rawQuery": true,
"rawSql": "SELECT\n date_sub(now(), interval 1 hour) AS \"time\",\n count(id) AS Running\nFROM job_job\nWHERE\n start_time < date_sub(now(), interval 1 hour)\nAND \n (\n state = 'R'\n OR (end_time > date_sub(now(), interval 1 hour) AND state = 'C')\n )",
"refId": "running_60",
"select": [
[
{
"params": [
"id"
],
"type": "column"
}
]
],
"table": "accounting_billgroup",
"timeColumn": "last_operation_time",
"timeColumnType": "timestamp",
"where": [
{
"name": "$__timeFilter",
"params": [],
"type": "macro"
}
]
},
{
"datasource": {
"type": "mysql",
"uid": "9jkl9yj7k"
},
"format": "time_series",
"group": [],
"hide": false,
"metricColumn": "none",
"rawQuery": true,
"rawSql": "SELECT\n date_sub(now(), interval 50 minute) AS \"time\",\n count(id) AS Running\nFROM job_job\nWHERE\n start_time < date_sub(now(), interval 50 minute)\nAND \n (\n state = 'R'\n OR (end_time > date_sub(now(), interval 50 minute) AND state = 'C')\n )",
"refId": "running_50",
"select": [
[
{
"params": [
"id"
],
"type": "column"
}
]
],
"table": "accounting_billgroup",
"timeColumn": "last_operation_time",
"timeColumnType": "timestamp",
"where": [
{
"name": "$__timeFilter",
"params": [],
"type": "macro"
}
]
},
{
"datasource": {
"type": "mysql",
"uid": "9jkl9yj7k"
},
"format": "time_series",
"group": [],
"hide": false,
"metricColumn": "none",
"rawQuery": true,
"rawSql": "SELECT\n date_sub(now(), interval 40 minute) AS \"time\",\n count(id) AS Running\nFROM job_job\nWHERE\n start_time < date_sub(now(), interval 40 minute)\nAND \n (\n state = 'R'\n OR (end_time > date_sub(now(), interval 40 minute) AND state = 'C')\n )",
"refId": "running_40",
"select": [
[
{
"params": [
"id"
],
"type": "column"
}
]
],
"table": "accounting_billgroup",
"timeColumn": "last_operation_time",
"timeColumnType": "timestamp",
"where": [
{
"name": "$__timeFilter",
"params": [],
"type": "macro"
}
]
},
{
"datasource": {
"type": "mysql",
"uid": "9jkl9yj7k"
},
"format": "time_series",
"group": [],
"hide": false,
"metricColumn": "none",
"rawQuery": true,
"rawSql": "SELECT\n date_sub(now(), interval 30 minute) AS \"time\",\n count(id) AS Running\nFROM job_job\nWHERE\n start_time < date_sub(now(), interval 30 minute)\nAND \n (\n state = 'R'\n OR (end_time > date_sub(now(), interval 30 minute) AND state = 'C')\n )",
"refId": "running_30",
"select": [
[
{
"params": [
"id"
],
"type": "column"
}
]
],
"table": "accounting_billgroup",
"timeColumn": "last_operation_time",
"timeColumnType": "timestamp",
"where": [
{
"name": "$__timeFilter",
"params": [],
"type": "macro"
}
]
},
{
"datasource": {
"type": "mysql",
"uid": "9jkl9yj7k"
},
"format": "time_series",
"group": [],
"hide": false,
"metricColumn": "none",
"rawQuery": true,
"rawSql": "SELECT\n date_sub(now(), interval 20 minute) AS \"time\",\n count(id) AS Running\nFROM job_job\nWHERE\n start_time < date_sub(now(), interval 20 minute)\nAND \n (\n state = 'R'\n OR (end_time > date_sub(now(), interval 20 minute) AND state = 'C')\n )",
"refId": "running_20",
"select": [
[
{
"params": [
"id"
],
"type": "column"
}
]
],
"table": "accounting_billgroup",
"timeColumn": "last_operation_time",
"timeColumnType": "timestamp",
"where": [
{
"name": "$__timeFilter",
"params": [],
"type": "macro"
}
]
},
{
"datasource": {
"type": "mysql",
"uid": "9jkl9yj7k"
},
"format": "time_series",
"group": [],
"hide": false,
"metricColumn": "none",
"rawQuery": true,
"rawSql": "SELECT\n date_sub(now(), interval 10 minute) AS \"time\",\n count(id) AS Running\nFROM job_job\nWHERE\n start_time < date_sub(now(), interval 10 minute)\nAND \n (\n state = 'R'\n OR (end_time > date_sub(now(), interval 10 minute) AND state = 'C')\n )",
"refId": "running_10",
"select": [
[
{
"params": [
"id"
],
"type": "column"
}
]
],
"table": "accounting_billgroup",
"timeColumn": "last_operation_time",
"timeColumnType": "timestamp",
"where": [
{
"name": "$__timeFilter",
"params": [],
"type": "macro"
}
]
},
{
"datasource": {
"type": "mysql",
"uid": "9jkl9yj7k"
},
"format": "time_series",
"group": [],
"hide": false,
"metricColumn": "none",
"rawQuery": true,
"rawSql": "SELECT\n now() AS \"time\",\n count(id) AS Running\nFROM job_job\nWHERE\n start_time < now()\nAND \n (\n state = 'R'\n OR (end_time > now() AND state = 'C')\n )",
"refId": "running_0",
"select": [
[
{
"params": [
"id"
],
"type": "column"
}
]
],
"table": "accounting_billgroup",
"timeColumn": "last_operation_time",
"timeColumnType": "timestamp",
"where": [
{
"name": "$__timeFilter",
"params": [],
"type": "macro"
}
]
},
{
"datasource": {
"type": "mysql",
"uid": "9jkl9yj7k"
},
"format": "time_series",
"group": [],
"hide": false,
"metricColumn": "none",
"rawQuery": true,
"rawSql": "SELECT\n date_sub(now(), interval 1 hour) AS \"time\",\n count(id) AS Waiting\nFROM job_job\nWHERE\n submit_time < date_sub(now(), interval 1 hour)\nAND \n (\n (\n start_time > date_sub(now(), interval 1 hour)\n AND state in ('R', 'C')\n )\n OR state in ('Q', 'H', 'S')\n )",
"refId": "waiting_60",
"select": [
[
{
"params": [
"id"
],
"type": "column"
}
]
],
"table": "accounting_billgroup",
"timeColumn": "last_operation_time",
"timeColumnType": "timestamp",
"where": [
{
"name": "$__timeFilter",
"params": [],
"type": "macro"
}
]
},
{
"datasource": {
"type": "mysql",
"uid": "9jkl9yj7k"
},
"format": "time_series",
"group": [],
"hide": false,
"metricColumn": "none",
"rawQuery": true,
"rawSql": "SELECT\n date_sub(now(), interval 50 minute) AS \"time\",\n count(id) AS Waiting\nFROM job_job\nWHERE\n submit_time < date_sub(now(), interval 50 minute)\nAND \n (\n (\n start_time > date_sub(now(), interval 50 minute)\n AND state in ('R', 'C')\n )\n OR state in ('Q', 'H', 'S')\n )",
"refId": "waiting_50",
"select": [
[
{
"params": [
"id"
],
"type": "column"
}
]
],
"table": "accounting_billgroup",
"timeColumn": "last_operation_time",
"timeColumnType": "timestamp",
"where": [
{
"name": "$__timeFilter",
"params": [],
"type": "macro"
}
]
},
{
"datasource": {
"type": "mysql",
"uid": "9jkl9yj7k"
},
"format": "time_series",
"group": [],
"hide": false,
"metricColumn": "none",
"rawQuery": true,
"rawSql": "SELECT\n date_sub(now(), interval 40 minute) AS \"time\",\n count(id) AS Waiting\nFROM job_job\nWHERE\n submit_time < date_sub(now(), interval 40 minute)\nAND \n (\n (\n start_time > date_sub(now(), interval 40 minute)\n AND state in ('R', 'C')\n )\n OR state in ('Q', 'H', 'S')\n )",
"refId": "waiting_40",
"select": [
[
{
"params": [
"id"
],
"type": "column"
}
]
],
"table": "accounting_billgroup",
"timeColumn": "last_operation_time",
"timeColumnType": "timestamp",
"where": [
{
"name": "$__timeFilter",
"params": [],
"type": "macro"
}
]
},
{
"datasource": {
"type": "mysql",
"uid": "9jkl9yj7k"
},
"format": "time_series",
"group": [],
"hide": false,
"metricColumn": "none",
"rawQuery": true,
"rawSql": "SELECT\n date_sub(now(), interval 30 minute) AS \"time\",\n count(id) AS Waiting\nFROM job_job\nWHERE\n submit_time < date_sub(now(), interval 30 minute)\nAND \n (\n (\n start_time > date_sub(now(), interval 30 minute)\n AND state in ('R', 'C')\n )\n OR state in ('Q', 'H', 'S')\n )",
"refId": "waiting_30",
"select": [
[
{
"params": [
"id"
],
"type": "column"
}
]
],
"table": "accounting_billgroup",
"timeColumn": "last_operation_time",
"timeColumnType": "timestamp",
"where": [
{
"name": "$__timeFilter",
"params": [],
"type": "macro"
}
]
},
{
"datasource": {
"type": "mysql",
"uid": "9jkl9yj7k"
},
"format": "time_series",
"group": [],
"hide": false,
"metricColumn": "none",
"rawQuery": true,
"rawSql": "SELECT\n date_sub(now(), interval 20 minute) AS \"time\",\n count(id) AS Waiting\nFROM job_job\nWHERE\n submit_time < date_sub(now(), interval 20 minute)\nAND \n (\n (\n start_time > date_sub(now(), interval 20 minute)\n AND state in ('R', 'C')\n )\n OR state in ('Q', 'H', 'S')\n )",
"refId": "waiting_20",
"select": [
[
{
"params": [
"id"
],
"type": "column"
}
]
],
"table": "accounting_billgroup",
"timeColumn": "last_operation_time",
"timeColumnType": "timestamp",
"where": [
{
"name": "$__timeFilter",
"params": [],
"type": "macro"
}
]
},
{
"datasource": {
"type": "mysql",
"uid": "9jkl9yj7k"
},
"format": "time_series",
"group": [],
"hide": false,
"metricColumn": "none",
"rawQuery": true,
"rawSql": "SELECT\n date_sub(now(), interval 10 minute) AS \"time\",\n count(id) AS Waiting\nFROM job_job\nWHERE\n submit_time < date_sub(now(), interval 10 minute)\nAND \n (\n (\n start_time > date_sub(now(), interval 10 minute)\n AND state in ('R', 'C')\n )\n OR state in ('Q', 'H', 'S')\n )",
"refId": "waiting_10",
"select": [
[
{
"params": [
"id"
],
"type": "column"
}
]
],
"table": "accounting_billgroup",
"timeColumn": "last_operation_time",
"timeColumnType": "timestamp",
"where": [
{
"name": "$__timeFilter",
"params": [],
"type": "macro"
}
]
},
{
"datasource": {
"type": "mysql",
"uid": "9jkl9yj7k"
},
"format": "time_series",
"group": [],
"hide": false,
"metricColumn": "none",
"rawQuery": true,
"rawSql": "SELECT\n now() AS \"time\",\n count(id) AS Waiting\nFROM job_job\nWHERE\n submit_time < now()\nAND \n (\n (\n start_time > now()\n AND state in ('R', 'C')\n )\n OR state in ('Q', 'H', 'S')\n )",
"refId": "waiting_0",
"select": [
[
{
"params": [
"id"
],
"type": "column"
}
]
],
"table": "accounting_billgroup",
"timeColumn": "last_operation_time",
"timeColumnType": "timestamp",
"where": [
{
"name": "$__timeFilter",
"params": [],
"type": "macro"
}
]
}
],
"title": "Job Status",
"transformations": [
{
"id": "merge",
"options": {}
},
{
"id": "organize",
"options": {
"excludeByName": {},
"indexByName": {
"Running": 2,
"Time": 0,
"Waiting": 1
},
"renameByName": {}
}
}
],
"type": "timeseries"
}
],
"refresh": "",
"schemaVersion": 36,
"style": "dark",
"tags": [],
"templating": {
"list": []
},
"time": {
"from": "now-6h",
"to": "now"
},
"timepicker": {},
"timezone": "",
"title": "Dashboard",
"uid": "gRrD7rW4z",
"version": 7,
"weekStart": ""
}